
A/ Fighting climate change
As the cosmetics industry has low energy consumption and low CO2 emissions compared with other industries, L’Oréal is not subject to the CO2 emission quotas provided for by European regulations, whether for the industrial sites, administrative sites or research centres. However, L’Oréal, which has been committed to the efforts to fight climate change for many years, applies a particularly proactive policy for the reduction of its CO2 emissions.
Group greenhouse gas emissions
(Scopes 1 and 2, according to the GHG Protocol) Under the L’Oréal for the Future programme, the Group has set itself a target to reduce the CO2 emissions of all sites operated by the Group by 100% by the year 2025 (Scopes 1 and 2).
To limit its impact on climate change and achieve this target, L’Oréal has implemented a strategy based on three pillars:
- Reducing its energy needs by improving energy efficiency across all its facilities (buildings, equipment, etc.);
- Increasing the use of local renewable energy wherever possible;
- Achieving the targets defined for the sites without recourse to carbon offsetting.

CO2 EMISSIONS – SCOPE 1 OF INDUSTRIAL SITES
(thousands of tonnes of CO2 equivalent)(1)
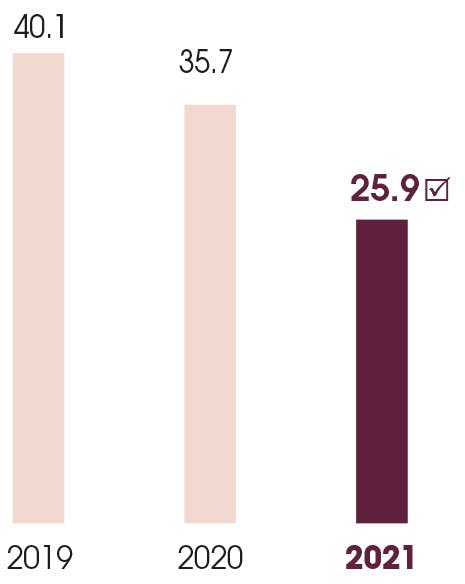
- ☑LThe Statutory Auditors have expressed reasonable assurance about this indicator.
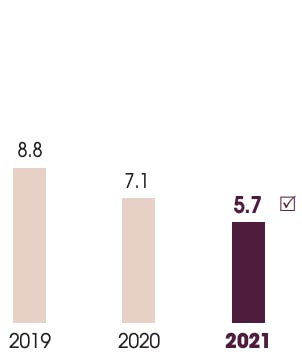
CO2 EMISSIONS – SCOPE 2 OF MARKET BASED ADMINISTRATIVE SITES AND RESEARCH CENTRES
(thousands of tonnes of CO2 equivalent)(1)
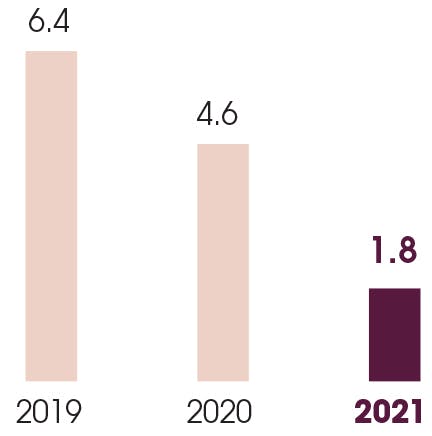

CO2 EMISSIONS – SCOPE 1 OF ADMINISTRATIVE SITES AND RESEARCH CENTRES
(thousands of tonnes of CO2 equivalent)(1)
- ☑The Statutory Auditors have expressed reasonable assurance about this indicator.

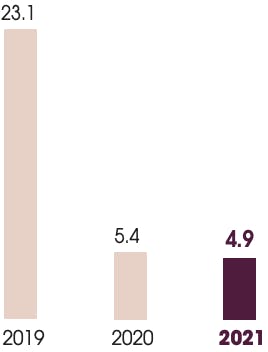
CO2 EMISSIONS – SCOPE 2 OF MARKET BASED INDUSTRIAL SITES
(thousands of tonnes of CO2 equivalent)(1)
(1) In this Document, the Group’s performance in terms of CO2 emissions is expressed in CO2 equivalent, i.e. CO2 eq. As per the Greenhouse Gas Protocol (GHG Protocol):Scope 1: “direct emissions from sources owned or controlled by the reporting entity”; Scope 2: “indirect emissions related to the consumption of electricity, heat or steam necessary for product processing or operating the reporting entity”; Scope 3: “other indirect emissions related to product supply chain (upstream emissions) and the use of products and services during their life cycle (downstream emissions)”.