
CO2 EMISSIONS – SCOPES 1 AND 2 OF INDUSTRIAL SITES
In 2021, CO2 emissions decreased by 35% compared to 2019 (a decrease of 87% compared to 2005), while production decreased by 0.4% compared to 2019 (an increase of 37% compared to 2005).

(in absolute terms: tonnes of CO2 equivalent at constant scope, as per the GHG Protocol)

CO2 EMISSIONS – SCOPES 1 AND 2 OF ADMINISTRATIVE SITES AND RESEARCH CENTRES
In 2021, CO2 emissions decreased by 77% compared to 2019 (a decrease of 83% compared to 2016).
This reduction was achieved thanks to the decrease in energy consumption from 2019 and the increased use of renewable energy for a large number of administrative sites and research centres. Indeed, energy consumption was down 9% from 2019,and the share of renewable energy rose to 82% (compared with 51% in 2019). In addition to the improvement projects in place, which continued in 2021, the Covid-19 health crisis also had a favourable impact on this result due to the lower number of hours spent on-site by teams.

(in absolute terms: tonnes of CO2 equivalent at constant scope, as per the GHG Protocol)

B/ Reducing energy consumption and making increased use of renewable energy
Reducing energy consumption
For over 20 years, the Group has been end eavouring to reduce its energy consumption. These efforts essentially concern two areas:
- continuous improvement of industrial processes and the performance of associated equipment; and
- optimisation of energy consumption in the buildings. In this respect, any new Group building has to comply with the strictest environmental standards.
AT INDUSTRIAL SITES
As part of the L’Oréal for the Future programme, the Group has set itself a new target for 2030: to reduce the energy consumption of its factories and distribution centres by 40% per thousand units of finished product, compared to 2019.
In 2021, the total energy consumption of the industrial sites was 783,211 megawatt-hours for 2021, a 5% increase in absolute value compared to 2019. This increase is driven by the change in the activity mix among the industrial sites, and the energy efficiency projects will continue in 2022.
Consumption in kilowatt-hours per finished product remained stable in 2021 compared to 2020 (decrease of 1%) and was up 5% compared to 2019.

TOTAL ENERGY CONSUMPTION OF INDUSTRIAL SITES IN KILOWATT-HOURS
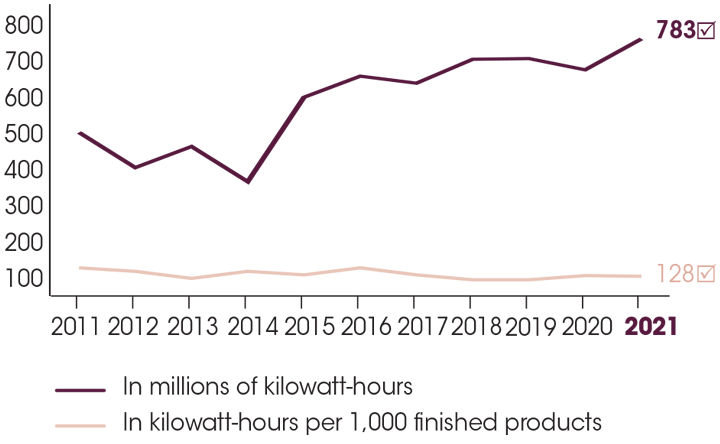
This graph shows the total energy consumption of industrial sites in kilowatt-hours.
In millions of kilowatt-hours:
- 2011: approximately 500
- 2016: approximately 650
- 2021: 783
In kilowatt-hours per 1,000 finished products:
- 2011: approximately 131
- 2016: approximately 133
- 2021: 128
☑The Statutory Auditors have expressed reasonable assurance with regard to this indicator.