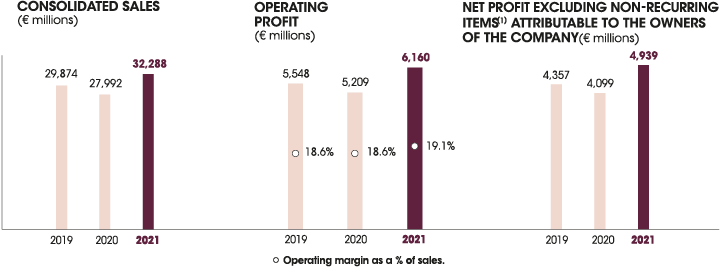
This graph shows the consolidated sales
(€ millions)
2019: 29,874,
2020: 27,992,
2021: 32,288
This graph shows the operating profit in millions of euros and the operating margin as a percentage.
Operating profit
2019: 5,548,
2020: 5,209,
2021: 6,160,
Operating margin
2019: 18.6 %
2020: 18.6 %
2021: 19.1 %
This diagram shows the net profit excluding non-recurring items attributable to the owners of the company
(in millions of euros)
2019: 4,357,
2020: 4,099,
2021: 4,939
BREAKDOWN OF SALES
By operational division
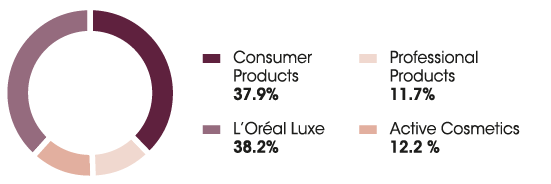
This diagram shows the breakdown of sales by operational division
Consumer products: 37.9 %
Professional products: 11.7 %
L'Oreal Luxe: 38.2 %
Active cosmetics: 12.2 %
By geographic zone
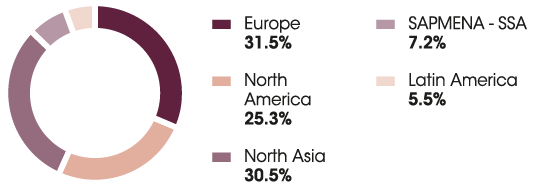
This diagram shows the breakdown of sales by geographical zone
Europe: 31.5 %
SAPMENA - SSA: 7.2 %
North America: 25.3 %
Latin America: 5.5 %
North Asia: 30.5 %
By currency
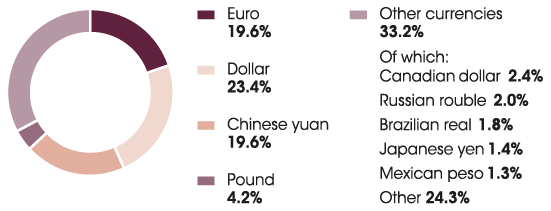
This diagram shows the breakdown of sales by currency
Euro: 19.6%
Dollar: 23.4%
Chinese Yuan: 19.6%
Pound sterling: 4.2%
Other currencies: 33.2%
of which
Canadian dollar: 2.4%
Russian ruble: 2.0%
Brazilian real: 1.8%
Japanese Yen: 1.4%
Mexican peso: 1.3%
Other: 24.3%
CHANGE IN THE L’ORÉAL SHARE PRICE COMPARED TO THE CAC 40 INDEX
(from 1 January 2010 to 26 February 2022)
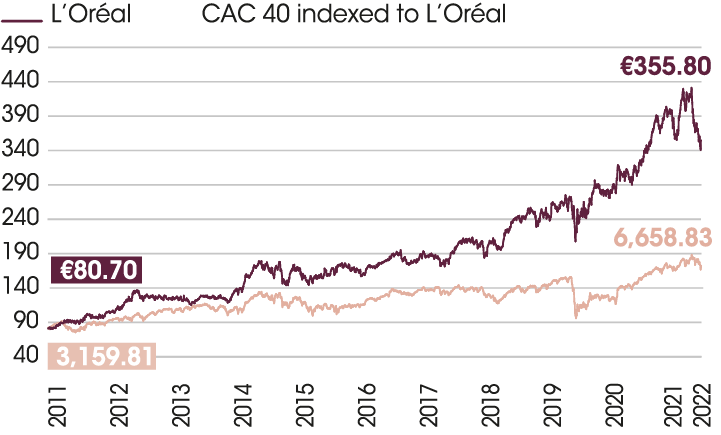
This graph shows the change in the L’Oréal to the CAC index
L’Oréal
- 12/2011: €80.70
- 28/02/2022: €355.80
CAC 40 indexed to L’Oréal
- 12/2011: €3,159.81
- 28/02/2022: €6,658.83
STEADY INCREASE IN DIVIDEND PER SHARE (€)

This graph shows the steady increase in the dividend per share in euros
More than 4.1 in 16 years
2006:1.18,
2007:1.38,
2008:1.50,
2009: 1.44,
2010: 1.80,
2011: 2.00,
2012: 2.30,
2013: 2.50,
2014: 2.70,
2015: 3.10,
2016: 3.30,
2017: 3.55,
2018: 3.85,
2019: 3.85(2)
2020: 4.00
2021: 4.80(3)
