NET DEBT
| 31.12.2019 | 31.12.2020 | 31.12.2021 | |
|---|---|---|---|
|
Net cash position = Net cash or net debt (in € million) (1) |
Net cash position = Net cash or net debt (in € million) (1) 31.12.20192,399.3(2) |
Net cash position = Net cash or net debt (in € million) (1) 31.12.2020+3,859.4(2) |
Net cash position = Net cash or net debt (in € million) (1) 31.12.2021-3,586.4(2) |
| Net debt ratio (Net financial position/Equity) | Net debt ratio (Net financial position/Equity) 31.12.2019n/a |
Net debt ratio (Net financial position/Equity) 31.12.2020n/a |
Net debt ratio (Net financial position/Equity) 31.12.202115.2% |
SHORT-TERM RATINGS
| A1 + | Standard & Poor’s | DECEMBER 2021 |
| PRIME – 1 | Moody’s | DECEMBER 2021 |
A SOLID BALANCE SHEET (€ MILLION)
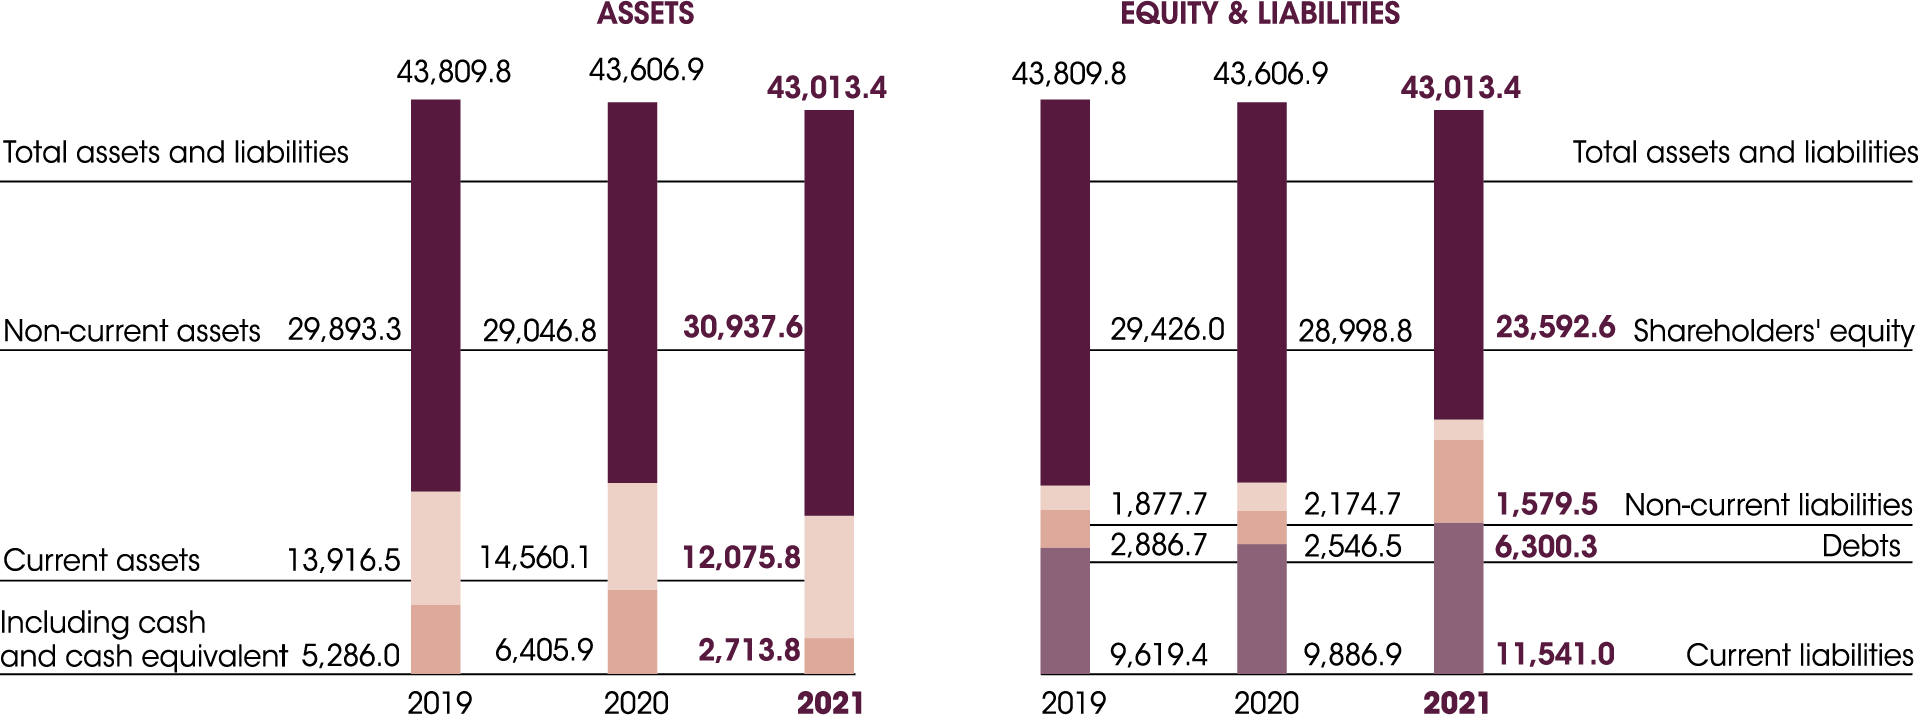
ASSETS
2019:
Total assets and liabilities: 43,809.8.
Non-current assets: 29,893.3.
Current assets: 13,916.5, including cash and cash equivalent: 5,286.0.
2020:
Total assets and liabilities: 43,606.9.
Non-current assets: 29,046.8.
Current assets: 14,560.1, including cash and cash equivalent: 6,405.9.
2021:
Total assets and liabilities: 43,013.4.
Non-current assets: 30,937.6.
Current assets: 12,075.8, including cash and cash equivalent: 2,713.8.
EQUITY & LIABILITIES
2019:
Total assets and liabilities: 43,809.8.
Shareholders' equity: 29,426.0.
Non-current liabilities: 1,877.7.
Debts: 2,886.7.
Current liabilities: 9,619.4.
2020:
Total assets and liabilities: 43,606.9.
Shareholders' equity: 28,998.8.
Non-current liabilities: 2,174.7.
Debts: 2,546.5.
Current liabilities : 9,886.9.
2021:
Total assets and liabilities: 43,013.4.
Shareholders' equity: 23,592.6.
Non-current liabilities: 1,579.5.
Debts: 6,300.3.
Current liabilities: 11,541.0.
1.2.3. The beauty market, a strong recovery in 2021
Warning: the competitive positions and market share held by the Group’s Divisions and brands mentioned in this Document are based on studies, panels and polls obtained from specialised organisations and companies, or, in the absence of comprehensive studies, are the result of estimates made by L’Oréal on the basis of available statistical data.
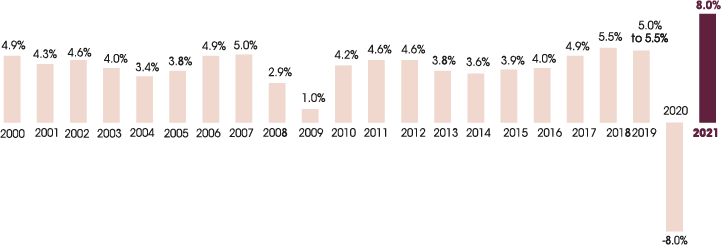
WORLDWIDE COSMETICS MARKET FROM 2000 TO 2021(1)