
| € millions 2020 | Sales | Operating profit | Operational Assets(1) | Investments in tangible and intangible assets | Depreciation, amortisation and provisions |
|---|---|---|---|---|---|
| Professional Products | Professional Products Sales3,097.3 |
Professional Products Operating profit581.7 |
Professional Products Operational Assets(1)2,962.6 |
Professional Products Investments in tangible and intangible assets63.1 |
Professional Products Depreciation, amortisation and provisions198.8 |
| Consumer Products | Consumer Products Sales11,703.8 |
Consumer Products Operating profit2,388.1 |
Consumer Products Operational Assets(1)9,887.6 |
Consumer Products Investments in tangible and intangible assets360.8 |
Consumer Products Depreciation, amortisation and provisions818.2 |
| L’Oréal Luxe | L’Oréal Luxe Sales10,179.9 |
L’Oréal Luxe Operating profit2,275.9 |
L’Oréal Luxe Operational Assets(1)8,773.4 |
L’Oréal Luxe Investments in tangible and intangible assets277.2 |
L’Oréal Luxe Depreciation, amortisation and provisions545.9 |
| Active Cosmetics | Active Cosmetics Sales3,011.1 |
Active Cosmetics Operating profit766.0 |
Active Cosmetics Operational Assets(1)2,524.2 |
Active Cosmetics Investments in tangible and intangible assets56.7 |
Active Cosmetics Depreciation, amortisation and provisions125.1 |
| TOTAL OF DIVISIONS | TOTAL OF DIVISIONS Sales27,992.1 |
TOTAL OF DIVISIONS Operating profit6,011.6 |
TOTAL OF DIVISIONS Operational Assets(1)24,147.7 |
TOTAL OF DIVISIONS Investments in tangible and intangible assets757.8 |
TOTAL OF DIVISIONS Depreciation, amortisation and provisions1,688.1 |
| Non-allocated | Non-allocatedSales - |
Non-allocatedOperating profit -802.6 |
Non-allocatedOperational Assets(1) 1,042.6 |
Non-allocatedInvestments in tangible and intangible assets 167.4 |
Non-allocatedDepreciation, amortisation and provisions 198.4 |
| GROUP | GROUPSales27,992.1 | GROUPOperating profit5,209.0 | GROUPOperational Assets(1)25,190.3 | GROUPInvestments in tangible and intangible assets925.2 | GROUPDepreciation, amortisation and provisions1,886.4 |
(1) Operational assets mainly include goodwill, intangible and tangible assets, right-of-use assets, trade accounts receivable and inventories.
|
€ millions 2019 |
Sales | Operating profit | Operational Assets(1) | Investments in tangible and intangible assets | Depreciation, amortisation and provisions |
|---|---|---|---|---|---|
| Professional Products | Professional Products Sales3,441.9 |
Professional Products Operating profit691.6 |
Professional Products Operational Assets(1)3,506.1 |
Professional Products Investments in tangible and intangible assets85.7 |
Professional Products Depreciation, amortisation and provisions191.4 |
| Consumer Products | Consumer Products Sales12,748.2 |
Consumer Products Operating profit2,574.6 |
Consumer Products Operational Assets(1)10,700.0 |
Consumer Products Investments in tangible and intangible assets514.3 |
Consumer Products Depreciation, amortisation and provisions780.7 |
| L’Oréal Luxe | L’Oréal Luxe Sales11,019.8 |
L’Oréal Luxe Operating profit2,493.7 |
L’Oréal Luxe Operational Assets(1)7,941.7 |
L’Oréal Luxe Investments in tangible and intangible assets514.4 |
L’Oréal Luxe Depreciation, amortisation and provisions592.9 |
| Active Cosmetics | Active Cosmetics Sales2,663.7 |
Active Cosmetics Operating profit620.8 |
Active Cosmetics Operational Assets(1)2,374.1 |
Active Cosmetics Investments in tangible and intangible assets66.1 |
Active Cosmetics Depreciation, amortisation and provisions92.3 |
| TOTAL OF DIVISIONS | TOTAL OF DIVISIONSSales29,873.6 | TOTAL OF DIVISIONSOperating profit6,380.7 | TOTAL OF DIVISIONSOperational Assets(1)24,521.8 | TOTAL OF DIVISIONSInvestments in tangible and intangible assets1,180.5 | TOTAL OF DIVISIONSDepreciation, amortisation and provisions1,657.3 |
| Non-allocated | Non-allocatedSales - |
Non-allocatedOperating profit -833.2 |
Non-allocatedOperational Assets(1) 1,077.6 |
Non-allocatedInvestments in tangible and intangible assets 142.4 |
Non-allocatedDepreciation, amortisation and provisions 199.6 |
| GROUP | GROUPSales29,873.6 | GROUPOperating profit5,547.5 | GROUPOperational Assets(1)25,599.5 | GROUPInvestments in tangible and intangible assets1,322.9 | GROUPDepreciation, amortisation and provisions1,856.9 |
(1) Operational assets mainly include goodwill, intangible and tangible assets, right-of-use assets, trade accounts receivable and inventories.
Operational assets can be reconciled to the 2021,2020 and 2019 balance sheets as follows:
| € millions | 2021 | 2020 | 2019 |
|---|---|---|---|
| Operational assets | Operational assets202126,975.7 | Operational assets202025,190.3 | Operational assets201925,599.5 |
| Non-current financial assets | Non-current financial assets 202110,920.2 |
Non-current financial assets 20209,604.8 |
Non-current financial assets 201910,819.1 |
| Investments accounted for under the equity method | Investments accounted for under the equity method 20219.9 |
Investments accounted for under the equity method 202011.1 |
Investments accounted for under the equity method 201910.9 |
| Deferred tax assets | Deferred tax assets 2021696.5 |
Deferred tax assets 2020809.9 |
Deferred tax assets 2019777.3 |
| Other current assets | Other current assets 20211,697.4 |
Other current assets 20201,584.9 |
Other current assets 20191,317.1 |
| Cash and cash equivalents | Cash and cash equivalents 20212,713.8 |
Cash and cash equivalents 20206,405.9 |
Cash and cash equivalents 20195,286.0 |
| Non-allocated assets | Non-allocated assets2021 16,037.7 |
Non-allocated assets2020 18,416.6 |
Non-allocated assets2019 18,210.3 |
| TOTAL ASSETS | TOTAL ASSETS202143,013.4 | TOTAL ASSETS202043,606.9 | TOTAL ASSETS201943,809.8 |
3.1.2. Information by geographic zone
All information is presented on the basis of geographic location of the subsidiaries.
During the first half of 2021, the Group redefined its geographic zones. Sales by geographic zone reflect this organisation and breakdown as follows: Europe, North America, North Asia, SAPMENA – SSA(1) and Latin America. The data relating to previous periods have been restated to reflect these changes.
3.1.2.1. Consolidated net sales by geographic zone
WEIGHT OF NET SALES BY GEOGRAPHIC ZONE OVER THE THREE PERIODS
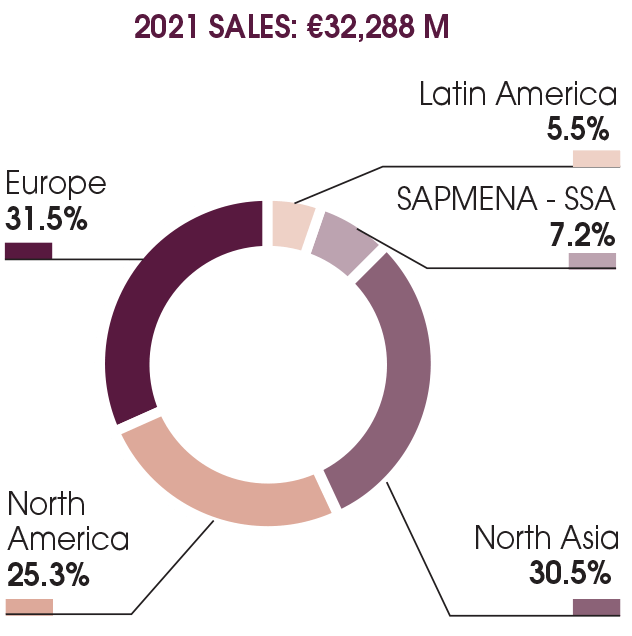
This graph shows the weight of net sales by geographic zone over three periods
2021 SALES: €32,288 M
Europe : 31.5%
Latin America : 5.5%
SAPMENA - SSA : 7.2%
North Asia : 30.5%
North America : 25.3%

2020 SALES: €27,992 M
Europe : 32.9%
Latin America : 5.2%
SAPMENA - SSA : 7.5%
North Asia : 29.7%
North America : 24.7%
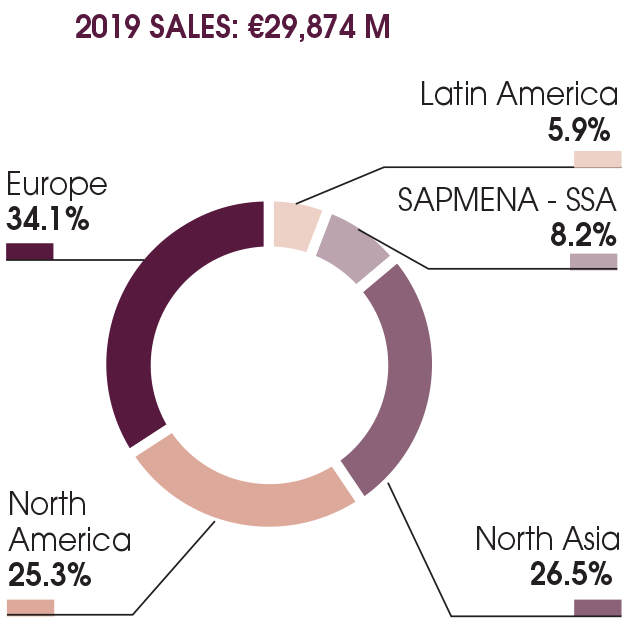
2019 SALES: €29,874 M
Europe : 34.1%
Latin America : 5.9%
SAPMENA - SSA : 8.2%
North Asia : 26.5%
North America : 25.3%